Liu, Hanyu, and Wanglin Yan. 2025. “Exploring Urban Resilience through the Food–Water–Energy Nexus during the COVID-19 Pandemic: Insights from the Great Pause in Tokyo.” Journal of Cleaner Production 523: 146410.

Abstract
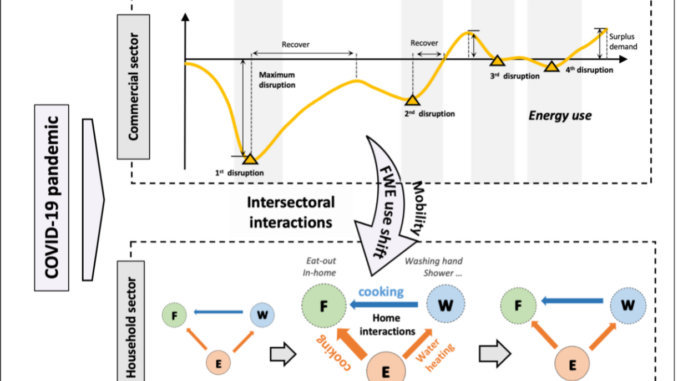
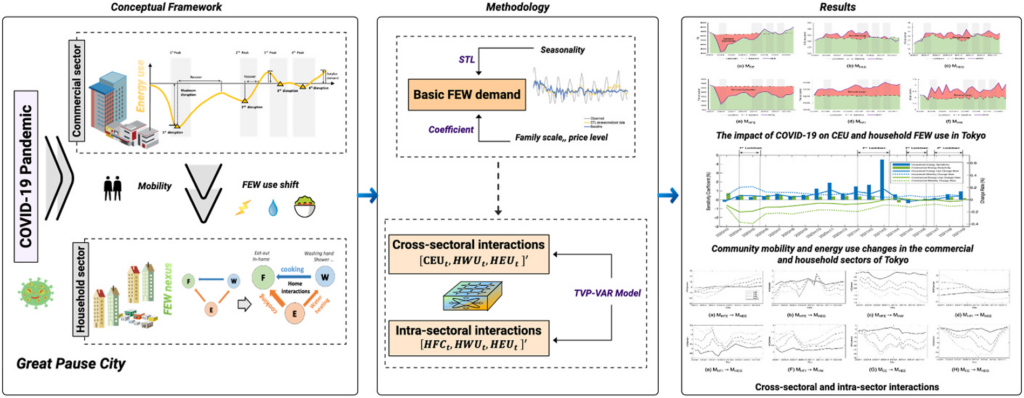
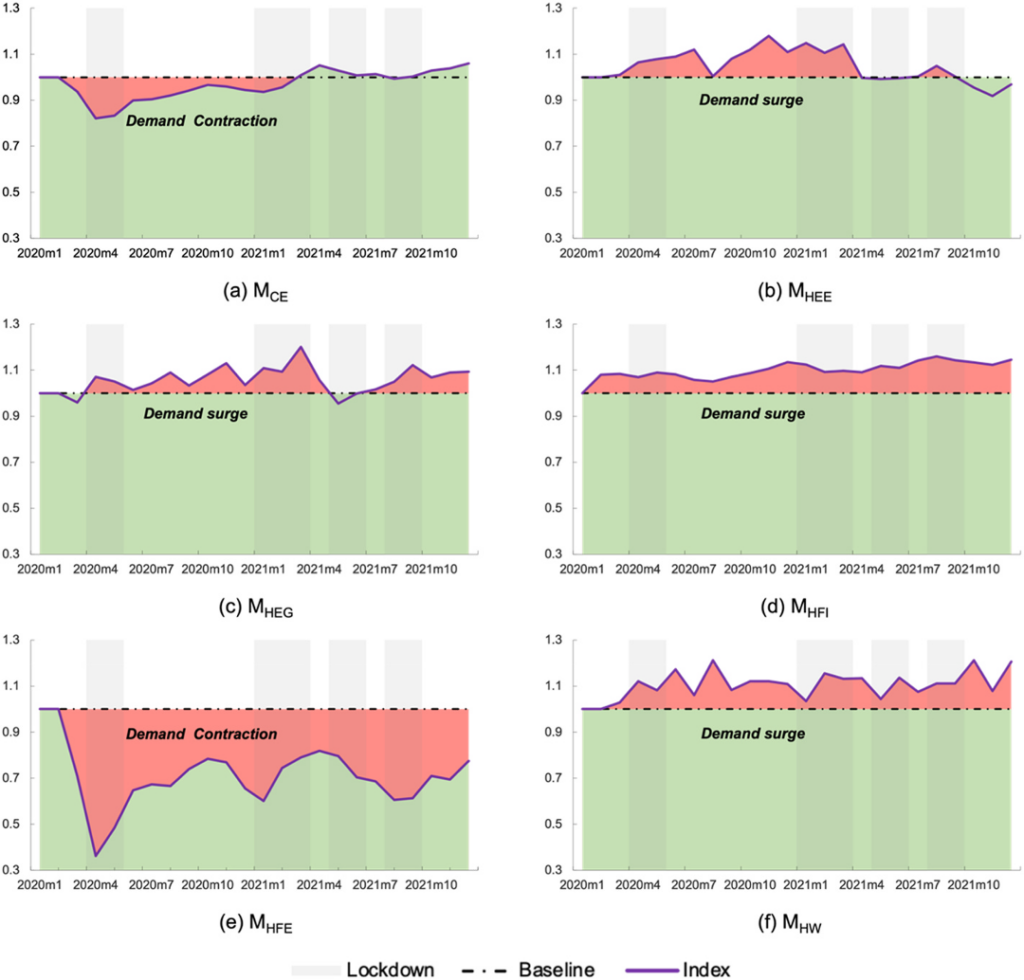
The COVID-19 lockdown measures across countries led to drastic fluctuations in resource utilization, which plunged cities into a state of “The Great Pause” and exposing the fragility of urban systems. The evolving nature of the pandemic complicated the long-term management of urban food, energy and water (FEW) services, emphasizing the intensive interconnections among these resources. Although many studies have examined sectoral disruptions in isolation, the interconnections between FEW resources across sectors remain underexplored. Using Tokyo as a case study, this study investigates the resilience of an urban basic supply system during COVID-19. The impact of the pandemic on FEW consumption patterns is evaluated by controlling for factors such as seasonality, trends, and prices. A time-varying parameter vector autoregression model was applied to analyze disturbances and recovery of FEW consumption, revealing disruptions and interactions across FEW sectors. Our findings reveal a sharp decline in commercial energy use during the Great Pause, with reductions of up to 18% per month compared to the baseline. In contrast, household energy use increased drastically, surging by as much as 15%, primarily due to increased heating demands and high in-home food expenditures. These shifts revealed altered urban resource use patterns and highlighted challenges in adapting resource subsystems. In addition, the sensitivity of energy consumption to community mobility revealed variations in energy use efficiency across sectors. This study demonstrates the potential of using the Great Pause as a critical benchmark for assessing essential resource demands during major disruptions.

Fig. 2. Indices of commercial energy use (CEU) and household FEW consumption in Tokyo during the COVID-19 pandemic (2020–2021). All series have been adjusted for seasonality, price fluctuations, and demographic changes. The index is normalized to a baseline value of 1, representing typical pre-pandemic levels. Panels (a)–(f): (a) commercial energy use (MCE), (b) household electricity (MHEE), (c) household gas (MHEG), (d) in-home food expenditure (MHFI), (e) eat-out food expenditure (MHFE), and (f) household water use (MHW). Purple lines denote consumption indices; red/green shading indicates surges/contractions; grey bars represent lockdowns.